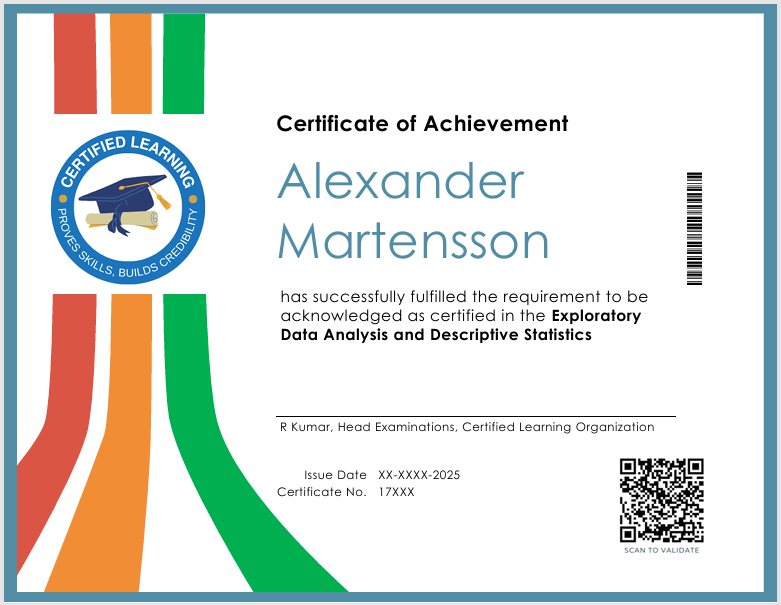
Exploratory Data Analysis & Descriptive Statistics
Descriptive Statistics focuses on summarizing and organizing data to provide meaningful insights. It includes techniques for measuring central tendency (mean, median, mode) to determine the data's center, and dispersion measures like range, variance, and standard deviation to assess variability. Graphical representations such as histograms, bar charts, pie charts, and box plots help visualize data distribution and patterns. Descriptive statistics also involve analyzing data distribution through skewness and kurtosis to understand its shape. Additionally, it employs measures of position, such as percentiles and quartiles, to describe data in relative terms. These tools are foundational for data analysis, enabling clear communication of data trends and characteristics.
Key Topics for Certifications
- Introduction to Descriptive Statistics
- Data Types
- Data Representation
- Measures of Central Tendency
- Measures of Dispersion
- Shape of Data Distribution
- Measures of Position
- Data Summarization Techniques
- Outlier Detection
- Exploratory Data Analysis (EDA)
- Applications of Descriptive Statistics
Certifications Details
| Certification Exam Code | : | DA-CL-STS-20 |
| Certification Name | : | Exploratory Data Analysis & Descriptive Statistics Certificate |
| Difficulty Level | : | Intermediate |
| Mode | : | Online |
| Exam Proctoring | : | AI Proctored |
| No. of Questions | : | 35-45 |
| Online Exam Duration | : | 35-50 Minutes |
*other than Indian market fees would be charged in USD.

